Hi.
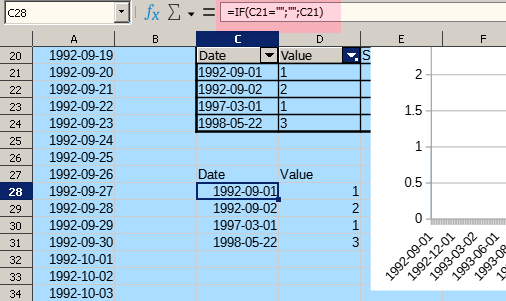
I’ve got some data in a pivot table. Two columns, a date and the count of activities on that date - a bit like
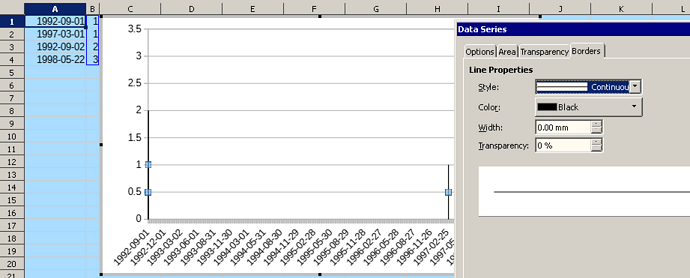
1/9/92 1
2/9/92 2
1/3/97 1
22/5/98 3
etc.
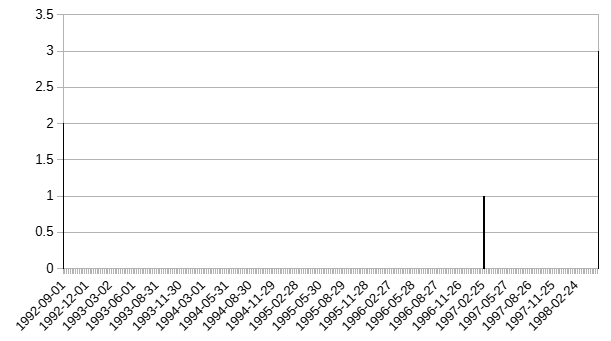
I want to plot these on a bar chart with the date running along the X axis and the activity count on the Y axis. I can do this by selectingthe Pivot table and inserting a bar chart, but all the activities are next to each other. What I want to see is the count of activities on 1/1/92, then 2/9/92, then there should be a gap of about 4.5 years until the next count on 1/3/97. Instead, the bar chart puts all the dates next to each other. Is there a way of having the elapsed date on the X-axis without having to do it mandrualically (i.e. I could create a table with all the dates from 1/9/91to whenever my data ends and then use countif on the source data. This would be a pain cos the activities are ongoing and also I don’t want to count all activities for a particular date, just the ones that meet a certain criteria. Pivot table does all that for me. I could do it myself, but would have to create and maintain a few extra colums in the source data which I’d rather not do.).
Thanks in advance.


