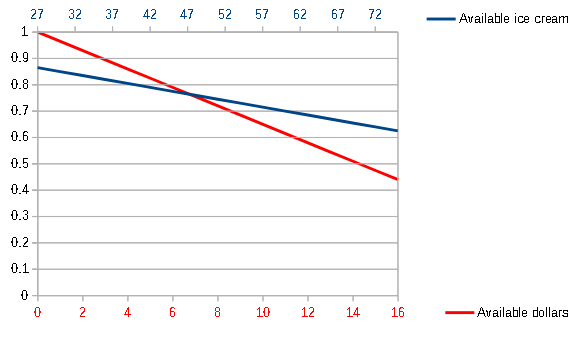
I’m trying to plot two data ranges on the same Y-axis, but cannot for the life of me figure out how to add a data set to a secondary X-axis. See attached pictures and example file.
I want the “available ice cream” plotted on the secondary X-axis and primary Y-axis, and “available dollars” plotted on the primary X-axis and primary Y-axis. When the Range of X-values for the “available ice cream” data set is set to the proper range (B2:B18 - “Ice cream”), it just plots it on the primary X-axis (A2:A18 - “Dollars”). See image below. I want it to plot against the range of values in B2:B18, i.e. 27 - 75. This is a scatter graph.
Any help would be greatly appreciated. I can’t find any options in the Format Data Series or Chart Type dialogue boxes to plot on the secondary X-axis, only a secondary Y-axis, which is not enabled.
Running LibO v6.0.6.2, Windows x64. See attached example sheet. secondary x-axis range example.ods


