Calc XY-scatter-diagram: how to "fold" timed-data and overlay with previous year?

I have an xy-scatter diagram of timed data over multiple years. As there is seasonal changes, I’d like to visually compare with the previous year. So I took a screenshot of the 2 year diagram and manually “move” the last year over the previous year. But it is quite tedious to do in a image editor.
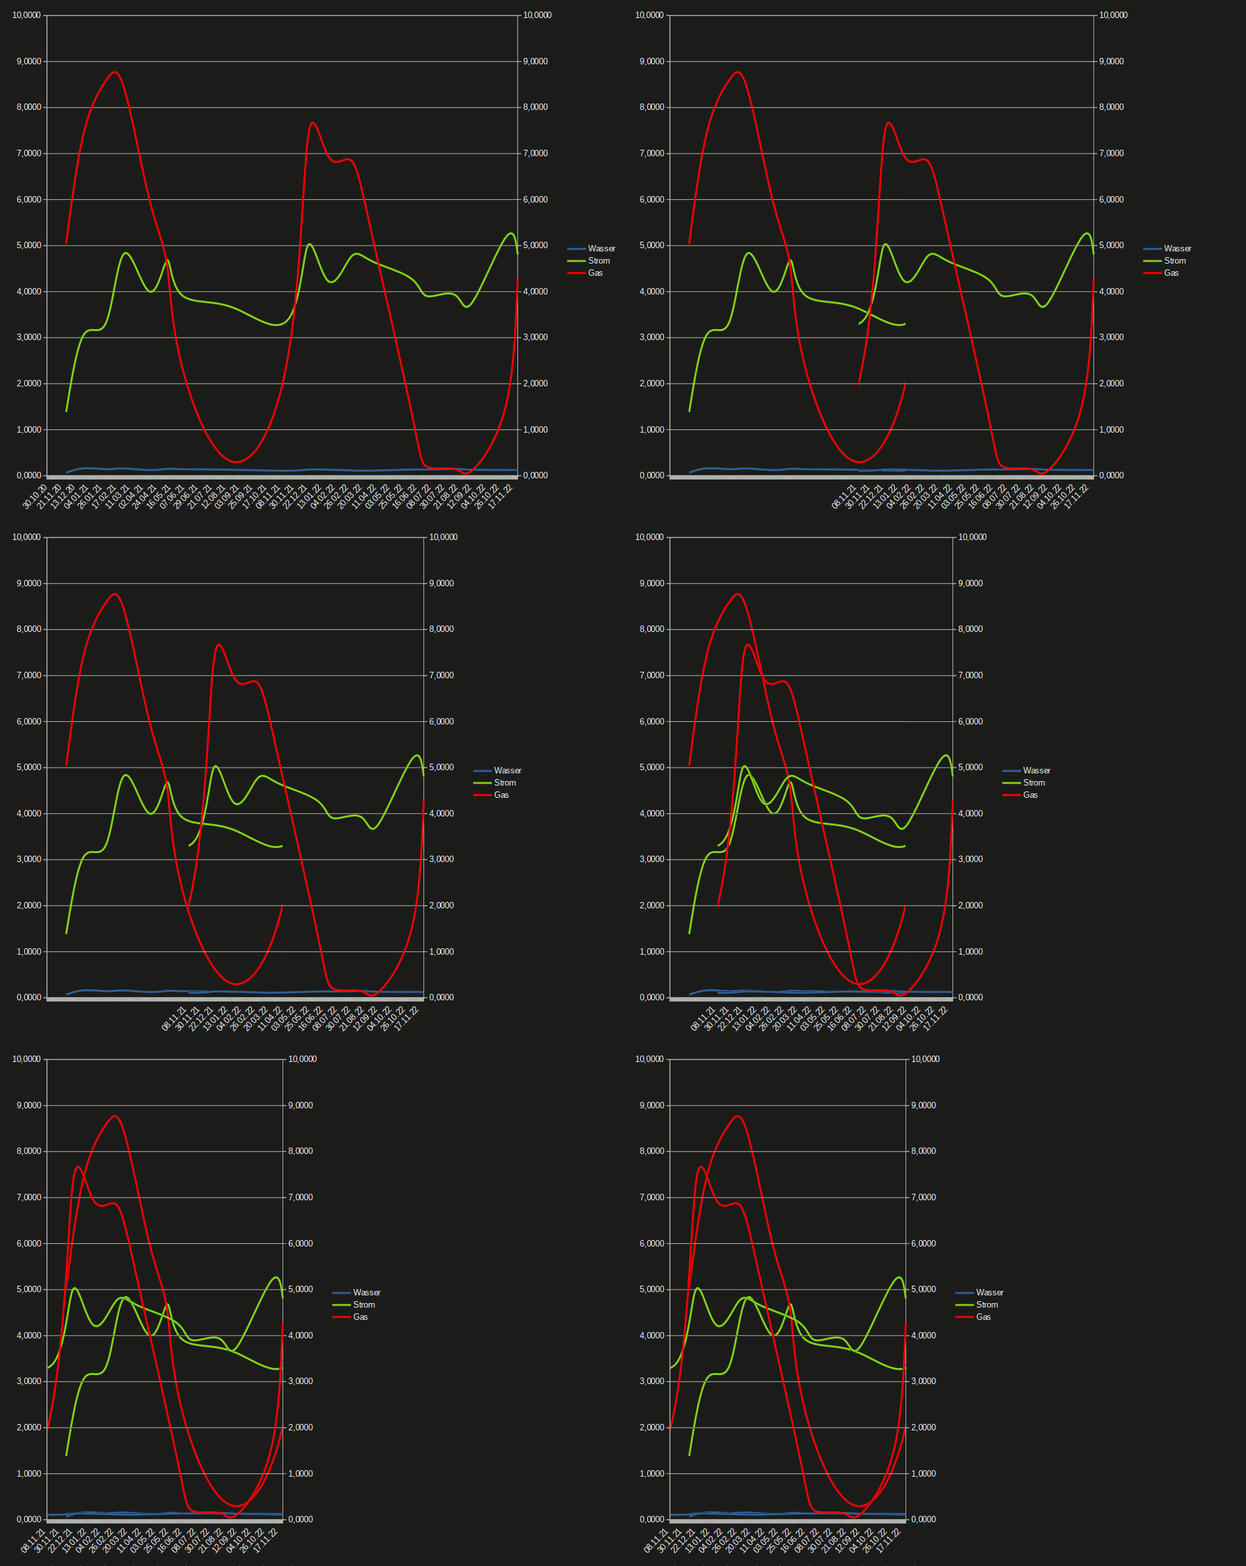
verbrauch

Here is an “animation”, of how I want to move the last year over the previous year. Of course, the animation is not part of the question, but only to illustrate how the end-result shall be composed.

Questions:
a) I can “filter” the data to “between two timestamps” and thereby select one year to be displayed in the diagram at one time. But how can I filter two distinct years at the same time? Or alternatively - how to dynamically select the data-range by a function?
b) How to overlap the 2022 and 2021 on the x-axis? Day of year seems not appropriate, because the diagram won’t start on Jan 1st but e.g. go from Nov 8th. Also I want the scale to display dates or month names and not 365 day-integers.
c) I like the curved interpolation, but it “forgets” about data-points, it cannot see anymore due to the filter and therefore the first and last curve segment never indicate, whether the first point was a local maximum starting with a horizontal tangent - instead they always give the impression, of a steep ascend/descend beyond the diagram. How can the curve interpolation consider the next adjacent value outside the data-range to correctly curve the spline as it would do, if more data were shown before and after?
d) As I’m lazy, I only register values at discrete dates with gaps of up to 8 weeks. So if a data-point is filtered due to a few days out of range, the first “valid” data-point in range might leave a big gap of more than a month at the start/end. How can I insert “artificial” datapoints at the yearly-cutoff, that force the line to touch the left and right scale, so that in theory I could do the reverse and connect the diagrams in an image editor to get back the full graph?
e) A trend-line for a single year is not very useful - e.g. the winter uses more gas, so if the diagram starts in spring, the summer will drag the left side down and the winter will at the same time pull the right side up. What I’d be interested in is the trend-line over two years - am I using more gas than last year or less? But how to visualize this? Can it be shown in the same diagram?
f) In the mock-up I didn’t change the lines, so they are hard to distinguish - only the animation helps a little. I thought of colorizing the space between the curves with different colors to visualize, if and where the current year is better or worse than the previous. But how to add colors or fill pattern between curves?
g) How to update the diagram when fresh data is added, so that it always displays two year back from the maximum in column A?

Finally here is my data for you to play around with:
Verbraunch.ods (61.3 KB)

Thanks in advance for your comments and your time :smiley:

  1. Your diagram isn’t x-y type (what’s correct) but “line” (what’s very bad as soon as the “categories” aren’t equidistant points in time any longer). Best abandon the “line” type completely. Less hokum, better information.
  2. Concerning the folding there isn’t any built-in tool I would know of. In roughly similar cases I actually made extra diagrams per “kind-of-cyclic” period and put them in the same place using transparency. the time-axis should then probably be formatted without the year while the year only is introduced via the name of the respective partial series.
  3. In your case you may get clearer visualisation if you create multiple triples of diagrams, some relating the three measures (for Water, EE, Gas), others relating the three years each for one of the goods. If you strictly regard to not edit (graphically) the diagrams differently, but keep them at exactly same size and division, you can combine any two or three of them.
  4. If diagrams aren’t exclusively for clear information by visualisation, they aren’t of any value and should go to the bin. There’s already too much fancy charting.
  1. Yes, my fault - I was switching diagram-types to see the effect - seems, I uploaded the wrong version. I intended it to be x-y.
  2. A 2nd see through diagram stacked on top of the first - clever! How do you control, that it really overlays the exact elements below - I mean like even the antialiased pixels of the texts? I guess, you better put in on a separate sheet and never resize / drag it - or it will be a nightmare, to align it again. Maybe I can delete most of the elements from the top layer diagrams, so they are not painted twice - but then it will zoom to a different size and shrinking it to fit with the underlying diagrams scales will be impossible. Also this technique eliminates any chance of filling the area between the graphs …
  3. Adding even more diagrams? So apply the trick from 2. over and over and over?
  4. I don’t understand …

My own thoughts were going into selecting the respective yearly data into a secondary sheet and base the diagram on that instead of only one autofilter.

Further questions:
a) Can the min and max of an auto-filter be controlled by a cells value / formula?
b) Can the min and max for an axis be controlled by a cells value / formula?

You can do a lot of things with charts if you are fond either of programming or of ticklish adjustment.
I personally don’t need charts much currently, and my charts always were rather simple (so I could overlay them if needed e.g.).
I should probably better not have stepped in here. The charts I actually overlaid using transparency were made fort teaching puposes, and that was more than 15 years ago. I forgot all the details - except that I “invented” the technique when I thought I “needed” it, and that it actually worked. Doing things of the kind in more complicated cases isn’t possible under “efficiency-pressure”. If there isn’t an internal drive to get it done “whatever it takes”, the only valuable advice I can give is to use simple ready-made tools, and to forget fancy ideas.
In specific regarding charts you come soon to the point where everything is much impress and little inform.
(PM ggf. auf Deutsch.)

Not very impressive, but probably useful may be the “filtering on the fly” where you can have all the (currently 9) diagram lines in one chart, and select by a single “Del” or “Enter something” which ones are actually shown.
Having opened the example regard the yellow cells in the range M2:W2.
VerbraunchRe.ods (41.2 KB)

Hello!
I have prepared your data per pivot table, in the example only with the power consumption values, the date values are on the one hand in the row field on the other hand also in the column field (there grouped by years)
See second sheet in attached file
Verbraunchsvisualisierung.ods (46.6 KB)