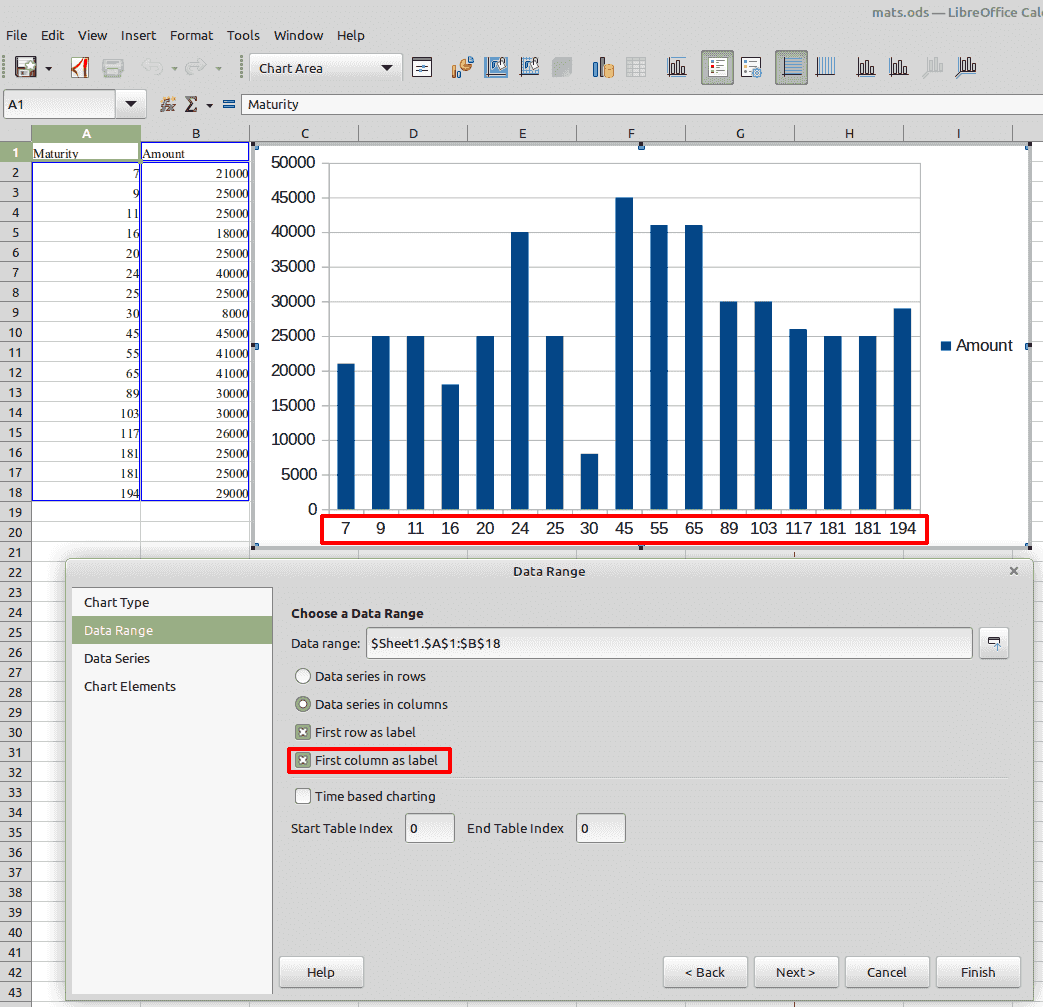
I’m trying to do a frequency distribution chart in calc. The data are in two columns in the spreadsheet. I want one series (Amount) to be the Y (vertical) axis, the other (Maturity, in days) to be the X (horizontal) axis. I want it to be a column chart showing Amount (Height of Column) for each Maturity (Days to maturity). But when I choose the Column type chart, it just puts 1,2,3,4… along the horizontal axis, ignoring the Maturity, and the Amount on the vertical axis. There doesn’t seem to be any way to choose Maturity for the X axis.
Sheet is attached. Any help appreciated.
mats.ods (12.8 KB)
Is there a way to scale the X-axis so that the columns occupy positions according to the number rather than being equidistant? I"m guessing not.
If you follow @PKG 's advice, you have to set the width of the entire diagram to approx. 20 cm (the bars will form into lines) or you transform the diagram to scatter (XY) and set lines and points stepped. Scatter diagram draws proportional values to x-axis (scaling to date)…
1 Like
I tried this. It works quite well. Thank you.

