How to place COLUMN D and Column F opposition in a BAR Chart
Column D on the right and Column F on the left, on the same chart layout
please see attachment
Image as an example
Two data sets opposite side of chart 07-05-2024.ods (39.3 KB)

How to place COLUMN D and Column F opposition in a BAR Chart
Column D on the right and Column F on the left, on the same chart layout
please see attachment
Image as an example
Two data sets opposite side of chart 07-05-2024.ods (39.3 KB)
I don’t quite understand what you mean. Can you elaborate or explain the question?
Column D on the left of the charts, and move column F to the right of the charts?
Or reverse the X axis so the graphs point in opposite directions?
Yes, thank U
“Column D on the left of the charts, and move column F to the right of the charts”
Column D on the right and Column F on the left, on the same chart layout
Then why is your answer Chart: two data sets opposite side of bar chart - #4 by LeroyG not correct? Because it uses negatives?
Yes, in the horizontal left axis.
Thank U, I updated my original post (image)
is there a way to perform without having to convert one set to a negative value.
an example of what I’m looking for …
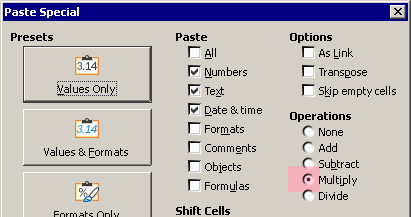
It is very simple: copy the value -1 and paste special over the list choosing Multiply:

Or you can use an auxiliary column with the formula =-D6, etc.
Not sure. Will test.
I can’t find a way. But, if the issue is the negative values in the chart, you can format the Y Axis numbers as 0;0, that is: positive and negative values without the minus sign.
That seems not to work:

Then I don’t think I understand what you’re trying to do. Can you draw an example?
Like this?
Two data sets opposite side of chart 07-05-2024 - Ash733 Changes.ods (40.3 KB)
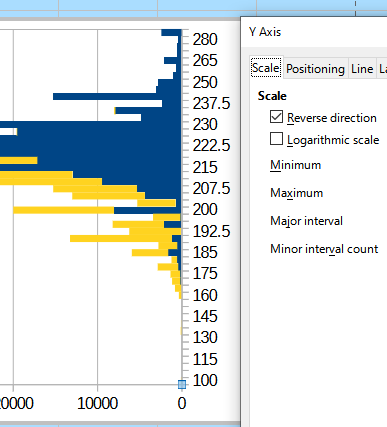
I double clicked the right chart, right clicked the Y axis and selected “Format Axis”, Selected “Reverse Direction”, and set the Axis maximum to 45000 to match the left chart. Then moved the chart elements so the text “Column F” is on the left side of the chart.
Now I understand what you mean:
You must remove the Strike (column E) from the ploted data series (see the little red squares near the right-side axis). But this will result in that the blue bar for 31 will be partly hidden by the yellow one.