You still didn’t reply to the questions contained n my first comment.
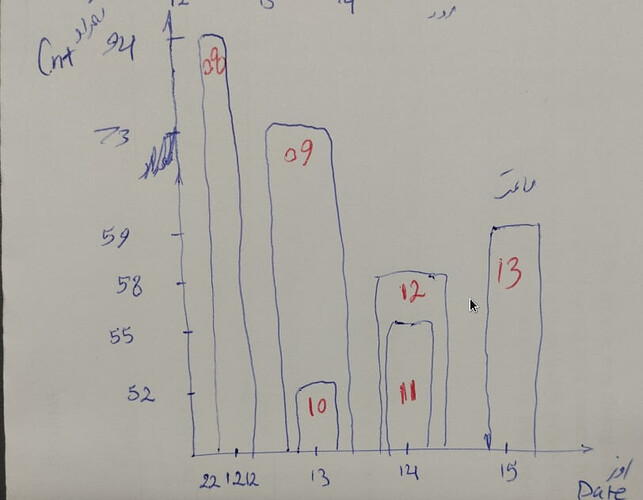
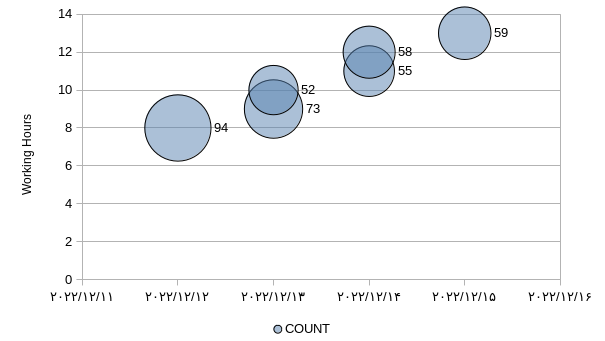
A pretty wild guess: you have some sort of workforce, and each person can work up to 13 hours on any given day. (0 h certainly happens, too).
Now you want to show for each day in an overview how many persons have worked one of the working times rounded to hours on this day.
In other words: You want a little histogram for each day, which counts the persons according to the number of hours they have worked on this day.
If so: WHY? And: Omit the idea as too complicated and not leading to an actually informative graphic.
A chart looking like your sketch with columns contained in other columns you can’t get anyway. Every day would be presented as a group of columns or (probably) as a stacked column of little value.
If you insist and hope to get a useful answer by somebody, you will need to provide a somehow realistic example of raw data. What you already supplied won’t help.
BTW There are already much too many useless graphics in the world, many of them emphasizing the tools they were made with instead of delivering clear information.


