Dear all!
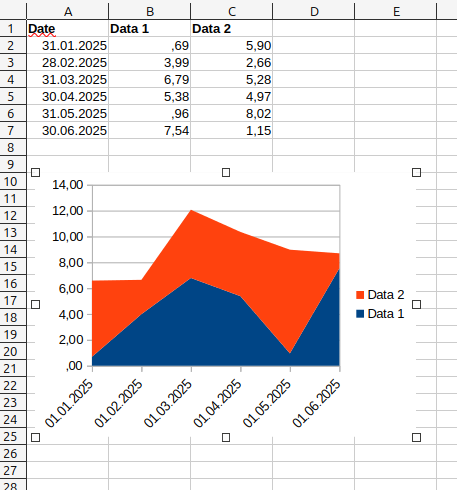
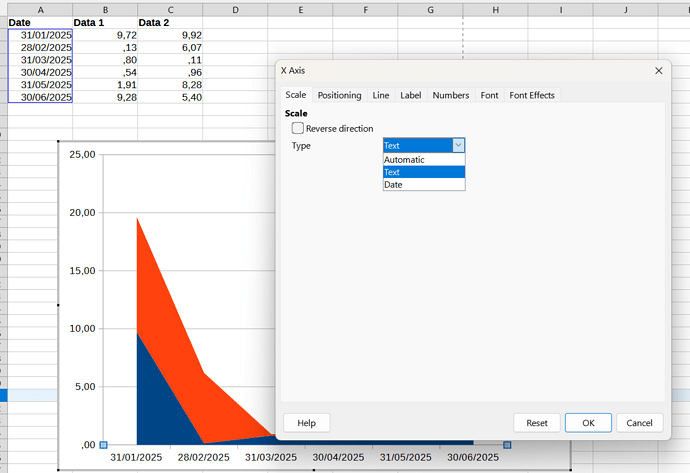
I’m using calc for various economical reporting. Data are normally per last of each month, but when I create diagrams, the first of each month is displayed in the diagram. I’m not quite sure if it’s related to my setup or a general bug/feature, so I’ve taken the liberty to attach both an example file with some random data and a screen shot.
I would expect and prefer the dates to be the last of each month also in the diagram.
In other cases where dates are more irregular, the labels on the diagram are like what I would expect.
I’m running version 24.2.7.2 on Linux Mint 22.1 Cinnamon.
Thanks for any input!
Kind regards
Karl Martin Lund
Date Issue.ods (23.6 KB)


