How to setup this type of bar?

I would like to have a bar that goes to the left if the percentage value is negative, and to the right if it’s possitive, and have the following colors:

-25% to 25: green

-50% to -26% and 26% to 50%: orange

-100% to -51% and 51% to 100% red (if value goes beyond -100% or 100% also red)

Example:

link text

It would be great if someone can post a .ods example so I can study how it was done (assuming Libreoffice can do this)


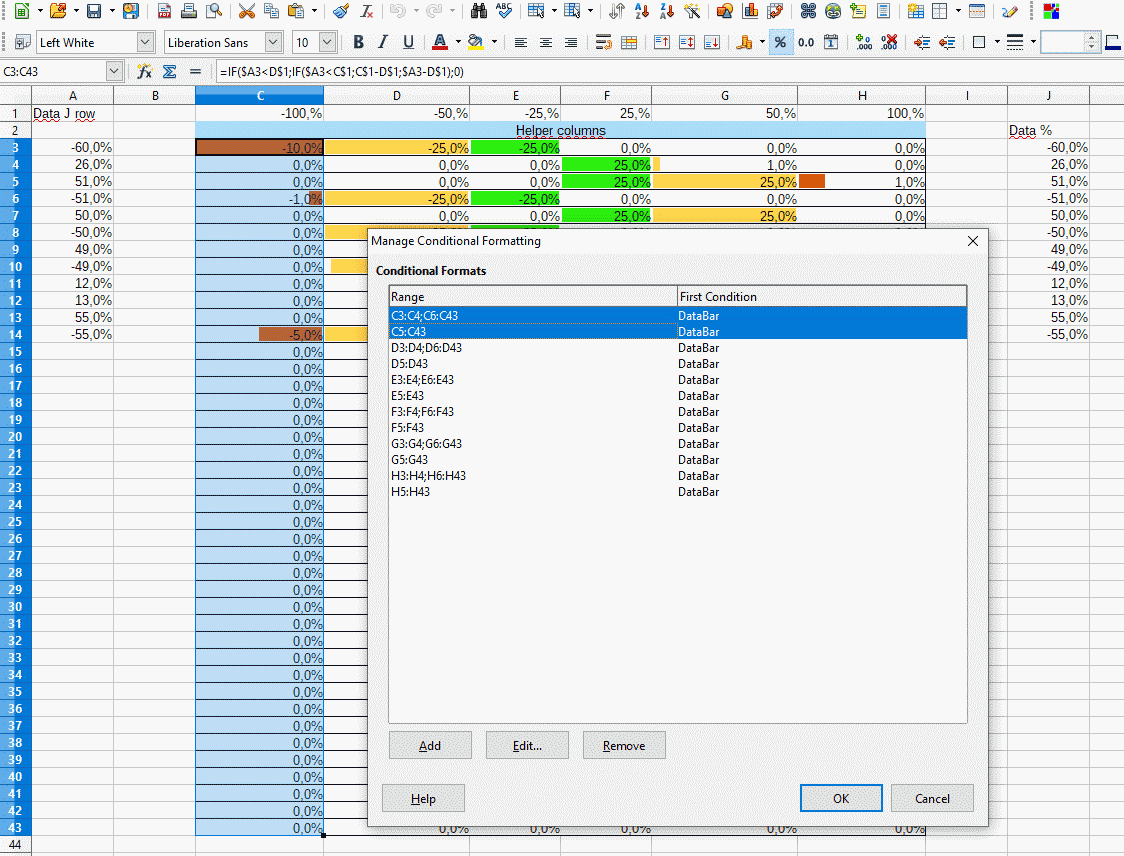
You have duplicated the CF ranges somehow. Check it in the Format - Conditional Formatting - Manage:

Hi, i have removed the duplicate ranges in “Conditional Formats” and the same is happening:

Can you download it and check it out?

Check the Formulas, the Cell Styles, the Conditional Formatting, and the proportionally adjusted column width in my sample file:

DataBar.ods

You can hide the results of the helper formulas by adjusting the CF properties of each colorized columns.

Hi, I have been testing with different numbers and using the % value from a different row and at some point it glitched out. Please see this:

As you can see for instance, the first line, -60 goes all the way to the left in the bar as if it was -100%

The 51% is too long on the right

55% goes all the way to the right as if it was 100%

-55% takes half of the orange bar to the left

It doesnt’ seem to show up as it should. Im not sure what is wrong. I’'ve tried to check out on the Format->Conditional but I don’t get how the bars work tbh

I’ve also noticed sometimes adding a new value changes the existing position of the other bars when it shouldn’t be happening.

I just wanted to replace the original “Data” row with my own percentages but when I tried to do that it glitches out.

Please upload (or link) your modified sample file here. You can upload it by esiting your first post (the question).

(((Sorry, I see now that your attachment is not an image only, but that is an .ods file… I will examine it.)))

You have duplicated the CF ranges somehow. See the attached image at my answer.

You can hide the results

I can’t find a way to do that; if I hide the values, the bars disappear.

Do not DELETE the formulas from the helper cells…

Just adjust the CF properties:
Format - Conditional - Manage - select a CF-ed range - Edit - More Options - set the option “Display bar only” - OK

Thanks @Zizi64. I was searching in the Cell dialog. I did not realize that CF is for Conditional Formatting.

Edit to add a second answer as asked in comment, and working with the sample file uploaded May 2.

Set columns width according to the % to be shown: I am setting C and H in 4 cm, and D to G in 2 cm.

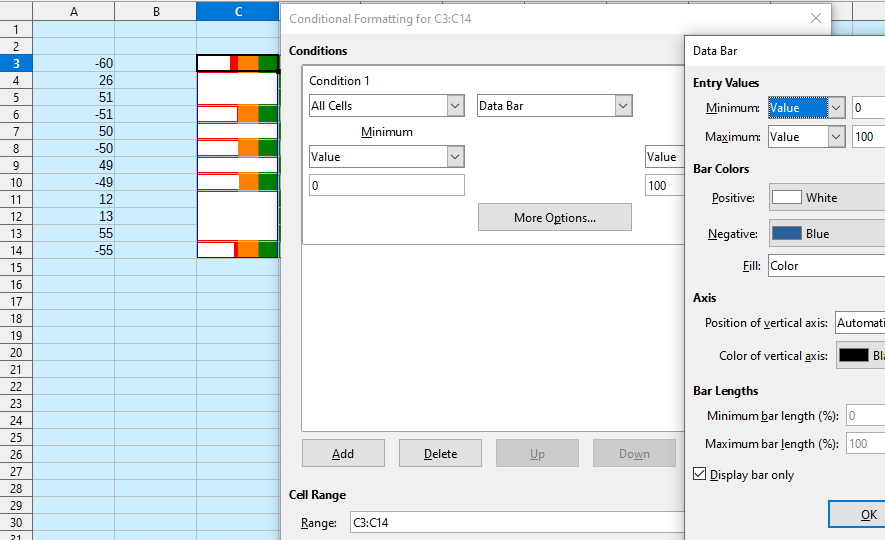
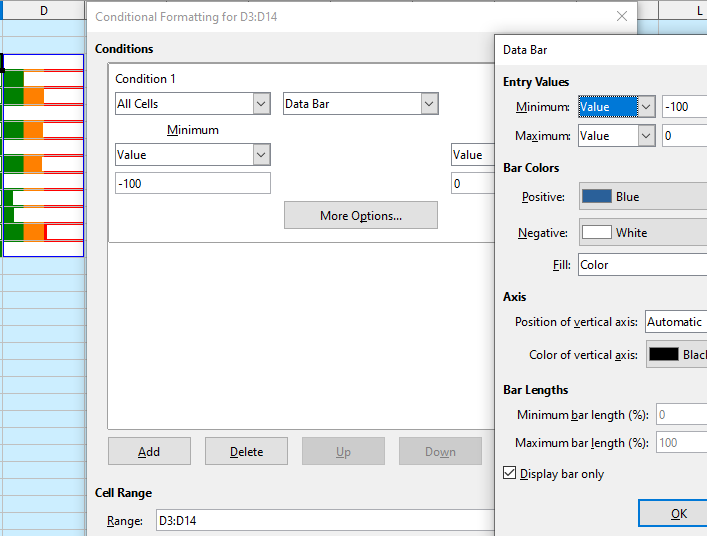
Conditions Minimum and Maximum values must be Value, and as follow:

  • Column C: -0.5 and 0
  • Column D: -0.25 and 0
  • Column E: -0.25 and 0
  • Column F: 0 and 0.25
  • Column G: 0 and 0.25
  • Column H: 0 and 0.5 (take note that 0.5 is equivalent to 50%)

To hide the numbers in the bars, in More Options… check Display bar only.

I think that formula in C3 (and other columns accordingly) can be simplified to: =IF($A3<D$1;-$A3+D$1;0).

See second sample file.


First answer:
I will propose an alternative solution with two images, and conditional formating in two cells side-by-side. See sample file (added later: see modified sample file in my first comment).

  • Values are in column A, beggining at row 3
  • Cells in column C have an image arranged to background (image description), and a formula (=100+A3), and conditional format

  • Cells in column C have another image arranged to background (image description), and another formula (=-100+A3)

EDIT: The images size is set to column width and row height, and its position set to protect. To do that, choose menu View - Toolbars - Drawing, pick the Select tool (an arrow), drag around the image to select it, and choose menu Format - Object - Position and Size… - Position and Size tab.

Once you have set the images in cells C3 and D3, copy and paste. Edit end here.

My background color is light blue, so I could have used light blue bars instead of white bars, and if background image on cell is set a few little in size it could simulate better that color bars appear.

Made with LibreOffice 6.4.7.2 (x86); OS: Windows 6.1.

LibreOffice Help on Conditional Formatting and Applying Conditional Formatting.


Add Answer is reserved for solutions. If you think the answer is not satisfactory, add a comment below, or click edit (below your question) to add more information. Thanks.

Check the mark (Answer markCorrect answer mark) to the left of the answer that solves your question (it may take a little while until it turns green).

If the answer helped you, you can mark the up arrow (Upvote mark) that is on the left (to vote, you need to have karma of at least 5).

Nice idea, the problem is that the borders look a bit weird since you can see the background image, so so you can see these green orange and red lines.

You can adjust the size and position of the images to your needs. See sample file with a slight change.

Do you have any idea why this doesn’t work?

It’s @Zizi64’s method that im tweaking and it’s not working.

Your method is cool but this one (if worked) would be easier to resize rows, expand etc.

Edit: Added @ (LeroyG)

Minimum and Maximum values of the condition must be 0 and 25 for F and G, and 0 and 50 to column H. In columns C to E you must invert, so -50 and 0, and -25 and 0.

Do you mean in the Data Bar window in “Entry Values” for minimum and maximun? I have tried and doesn’t work.
But I think Zizi64 wasn’t using these, it is using the numbers above the “helper columns” line.
Im not sure but its not working.

I think Zizi64 wasn’t using these

You are correct; but try deleting the A3:A12 values in the sample file provided to see what happen when values are set to automatic. Or in the file linked in your comment, write “-100” in A4, and see what happen to the colorbar in C3.

There is no problem referencing values in row 1.

I still don’t get how to fix it to make it work. Whats wrong?