Only Display Year for January on Line Chart X-Axis

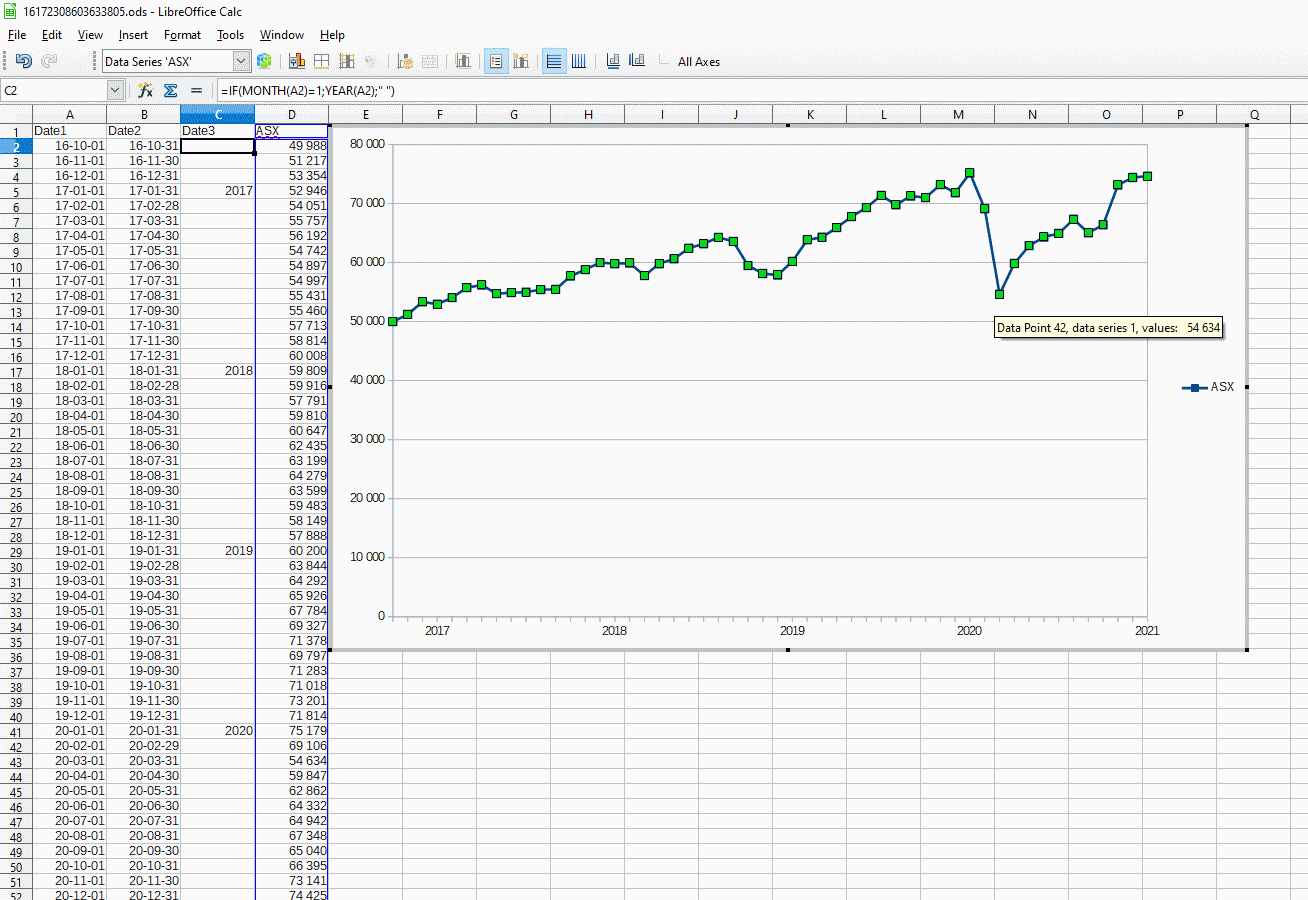
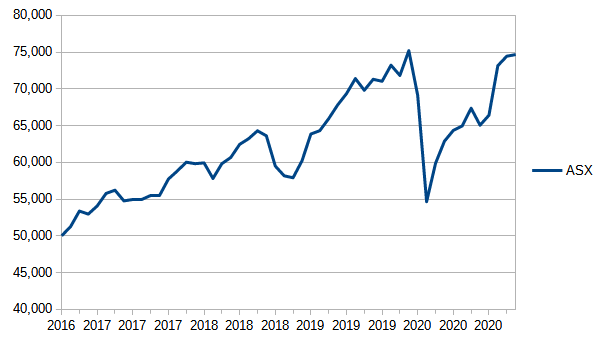
How do I just display the year for January on the X-axis?

I’d like to format the first column to calculate the last day of the month, allow date and value to be shown when hovering over the point, and only display the year on the x-axis for the January record.

image description


Adding some columns where Date1 is drag down, Date2 =EOMONTH(A2, 0) and Date3 =IF(MONTH(A2)=1,A2) formatted as YYYY. Unfortunately, it just fills all dates with 1899.

(Date format can be set in chart so maybe Date3 column not required.)

Date1	    Date2	    Date3
01/10/14	31/10/14	
01/11/14	30/11/14	
01/12/14	31/12/14	
01/01/15	31/01/15	2015
01/02/15	28/02/15	
01/03/15	31/03/15

ChartAxisDemo.ods

Please upload a real, ODF type sample file here. We can not examine the type of your data based on a picture.
And mybe it is better to use a Scatter diagram instead of the pure line chart.

Added sample file. This is not a line type issue.

Hello flywire,

Your If function is not complete. Please write:

=IF(MONTH(A2)=1,A2,"")

I hope this helps you.

https://help.libreoffice.org/4.4/Calc/Logical_Functions#IF otherwise is optional.

One issue is the x-axis does not have enough space for all years so it populates it with every fourth row, missing the January row.

Yes, otherwise is optional. But you still get a result. Namely True or False. In cases where the result of the IF question is false, you can also translate this with the number zero. Mark the cell as a number. Then you will see this. If you format a zero as a year, you will get the date 30.12.1899.
That is the reason why they have to enter a value in other cases.

16172308603633805.ods

To only display date for January this works. Format date as required (eg YY or Mmm YY) then display on chart in Source format or change format. Points must be enabled on the line type to display data (eg date, value) with tooltips.

Can you get it to only display the
year on the x-axis for the January
record?

Yes you can.
Just use the formula:

=IF(MONTH(A2)=1;YEAR(A2);"")

And do not format the result values (and the x-axis) as dates/years. They are pure integers.

Zizi64.ods

allow date and value to be shown when
hovering over the point,

Similar question

Second attachment

Zizi64_scatter.ods

Nice. Can the data point tooltip format be changed to just date and value? I think it might require the date to be added twice, once for the data point and once for the x-axis.

That is the Scatter diagram…

See the second attachment of my Answer.

Better to format as =IF(MONTH(A2)=1,A2,"") which is date not integer then format as required. I’m not convinced the chart has to be reformatted as a scatter chart. It looks like just date/value is not possible on chart point - Custom mouseover tooltips on cells