Sum of last 7 cells (and last week's dates)

Hey guys! Got a couple questions. I’ve started bicycling again for the first time in 30 years (but that’s another story…) I’m keeping track of my rides with a spreadsheet.

Column A has dates and column B has distances.
I’ve got a total miles count in a cell that does a SUM(B6:B1048576). So that’s working great, but I’d like to add a couple more bits of information there. How would I add up just the last 7 entries in column B? Is it possible to just do the last 7 days from when the final entry was? Or monthly totals? I’m probably getting beyond myself there. I did some spreadsheet work when I was in college but that was nearly 30 years ago.

What do you mean by “sum last week’s dates”?
You once talk of the “last 7 cells”, but then of the “last seven days…”. That’s not the same, is it?
Do you want to assure that there is exactly one entry per date? If so, please tell explicitly.

There are questions again and again addressing “last umpteen”.
There are no standard functions to directly access them.
Generally spreadsheets look up data top-down (or left-right).
Trying to do it reversely always causes complications.
I attach an example where you may compare the solutions for ordinary “conditional sums” using SUMIFS(), and the solution needing to acces “the last 7”.
disask67686KeepingTrackDistances.ods (31.8 KB)
The data contained in the sheet are generated randomly. You get a new example by full recalculation.

What I was originally thinking was just doing the last 7 rides. That would probably be easiest but then it occurred to me what if there’s more (or less) than 1 ride on a particular day so I was thinking maybe just do it as adding in all the rides from the last 7 days – but that would make things more complicated.

I’m trying to familiarize myself with this stuff it’s been ages since I’ve worked on spreadsheets. Once I get it all figured out again I’d like to find more ways to play around with the data but for now that’s what I’m looking at.

Try this.
ex-data-pivottable.ods (17.8 KB)

The pivot table is refreshed automatically (by a macro).


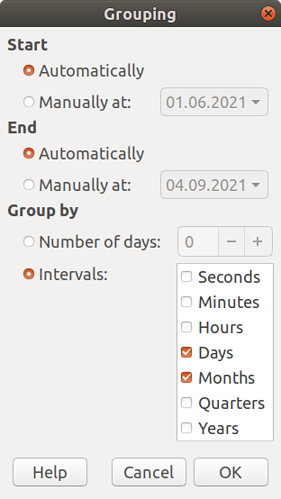
You can group it exactly in 7 days, if you like.

1 Like

Thanks I’ll look through this also!

@GrepP74, mark it as solution if it solved the problem.
I hope you understand how to group by 7 days, but the proposed method of grouping is just right (by days and months).

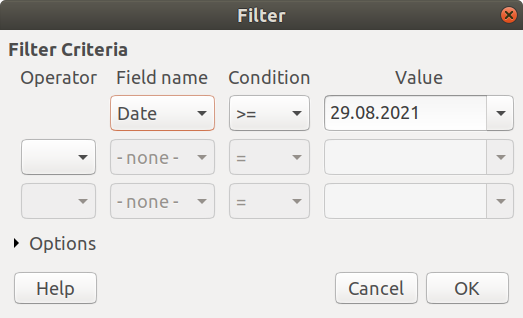
Or like this with the applied standard filter for the last 7 days.
Снимок экрана от 2021-09-04 12-06-28


Updated:
ex-bike-rides-pivottable.ods (21.5 KB)

In fact, you can use this example as the final application. Nothing needs to be changed. Just enter your data.

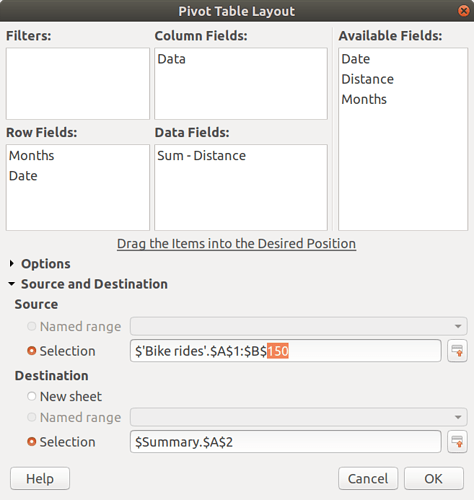
When the lower limit of the data source range is reached, manually change the value that is highlighted in the screenshot (with an excess of rows). You can also include all the rows ($‘Bike rides’.$A$1:$B$1048576). And don’t bother with it anymore.


Thanks so much!

Another solution with using an advanced filter & multiple operations.
Note: You need to know how to delete rows so that the source range is adjusted automatically. There is a button to add a new entry.

Updated:
ex-bike-rides-stats.ods (24.9 KB)

The criteria are set using formulas and captures the last 7 calendar days.

Added the necessary statistics on rides for periods. All data is updated automatically.
If you are interested, take a look. The attached file was updated.
I don’t know about you, but the level of development of pivot tables leaves much to be desired. In this case, you can do without a pivot table.

The mileage for a month of the year is calculated using multiple operations using the formula:
=SUMIFS($C$8:$C$100;$B$8:$B$100;">="&DATE($I$1;$J$1;1);$B$8:$B$100;"<="&EOMONTH(DATE($I$1;$J$1;1);0))

1 Like